|
|
Post by skywalker on Jul 12, 2015 12:25:04 GMT -6
|
|
|
|
Post by lois on Jul 12, 2015 22:10:57 GMT -6
2020 Is five years away sky. There is bound to be sea ice with it all falling in the oceans |
|
|
|
Post by lois on Jul 12, 2015 22:12:54 GMT -6
2020 Is five years away sky. There is bound to be sea ice with it all falling in the oceans. Science says science says. I don't always believe them. you know they have been wrong. They still bicker about Pluto not being a planet. Well one can see it certainly is. |
|
|
|
Post by swamprat on Jul 17, 2015 19:28:48 GMT -6
In the mean time.......  Sorry, Sky! Sorry, Sky! 
State of the Climate Report: Warm and Warmer (except for eastern North America)
By: Bob Henson,
July 17, 2015
Although the tropical Atlantic is heating up slightly with the appearance of a Cape Verde wave (see this morning’s tropical roundup post), we also have some toasty news on the national and global front. With our planet showing more and more symptoms of running a fever, the annual State of the Climate reports make for compelling lab results that confirm the diagnosis. This year’s State of the Climate report was released on Thursday as part of the July issue of the Bulletin of the American Meteorological Society. Like a mini-IPCC assessment, this year’s annual report--compiled by NOAA’s National Centers for Environmental Information--involved 413 authors and 17 editors from 58 countries who reviewed and synthesized a vast body of data on what’s happened to our Earth system in the past year, from greenhouse gas increases to sea level rise.
The 2014 State of the Climate report makes it plain that last year was a landmark in global warming. The record high in globally averaged temperature (a mark almost certain to be topped in 2015) got plenty of press, but other records were set as well:
• Carbon dioxide, methane, and nitrous oxide—three of the most important human-produced greenhouse gases—all reached their highest global concentrations since records have been kept.
• More than 20 nations reported their warmest year on record, as did the continent of Europe. The only large land area with below-average temperatures for the year (apart from western Siberia) was eastern North America.
• Sea surface temperatures and global sea level both reached record highs, continuing the trends of recent years.
• The extent of summertime Arctic sea ice remained well below its 1980s – 1990s average, though the ice loss in 2014 was less dramatic than in several years of the past decade. Meanwhile, Antarctic sea ice set new monthly extent records in each month from April to November, and the single largest extent on record was observed on September 20. It’s important to note that this wintertime ice growth around Antarctica has much less effect on climate than the summertime loss in the Arctic, largely because the Arctic loss occurs when more sunshine has a chance to be absorbed by open water.
More highlights from the report can be found in a NOAA news release and in the report itself.
www.noaanews.noaa.gov/stories2015/071615-international-report-confirms-2014-was-earths-warmest-year-on-record.html
www.ncdc.noaa.gov/bams-state-of-the-climate/2014.php
www.wunderground.com/blog/JeffMasters/comment.html?entrynum=3047
|
|
|
|
Post by swamprat on Nov 18, 2016 13:31:49 GMT -6
You had better hope they're right, Sky! We're gonna need an "ice age" to counter what we humans are doing to the environment.
Somebody needs to send this to Trump.....
The North Pole is an insane 36 degrees warmer than normal as winter descendsBy Chris Mooney and Jason Samenow
November 17
Political people in the United States are watching the chaos in Washington in the moment. But some people in the science community are watching the chaos somewhere else — the Arctic.
It’s polar night there now — the sun isn’t rising in much of the Arctic. That’s when the Arctic is supposed to get super-cold, when the sea ice that covers the vast Arctic Ocean is supposed to grow and thicken.
But in fall of 2016 — which has been a zany year for the region, with multiple records set for low levels of monthly sea ice — something is totally off. The Arctic is super-hot, even as a vast area of cold polar air has been displaced over Siberia.

Image obtained using a climate reanalyzer. (Climate Change Institute/University of Maine)
At the same time, one of the key indicators of the state of the Arctic — the extent of sea ice covering the polar ocean — is at a record low. The ice is freezing up again, as it always does this time of year after reaching its September low, but it isn’t doing so as rapidly as usual.
In fact, the ice’s area is even lower than it was during the record-low 2012:

(National Snow and Ice Data Center)
Twitter’s expert Arctic watchers also are stunned. Zack Labe, a PhD student at the University of California at Irvine who studies the Arctic, tweeted out an image on Wednesday from the Danish Meteorological Institute showing Arctic temperatures about 20 degrees Celsius higher than normal above 80 degrees North Latitude.
“Today’s latest Arctic mean temperature continues to move the wrong direction . . . up. Quite an anomalous spike!,” Labe wrote. Here’s the figure:

Daily mean temperatures for the Arctic area north of the 80th northern parallel. (Danish Meteorological Institute)
“Despite onset of Polar Night, temperatures near North Pole increasing. Extraordinary situation right now in Arctic, w/record low sea ice,” added Daniel Swain, a climate scientist at UCLA.
This is the second year in a row that temperatures near the North Pole have risen to freakishly warm levels. During 2015’s final days, the temperature near the Pole spiked to the melting point thanks to a massive storm that pumped warm air into the region.
So what’s going on here?
“It’s about 20C [36 degrees Fahrenheit] warmer than normall over most of the Arctic Ocean, along with cold anomalies of about the same magnitude over north-central Asia,” Jennifer Francis, an Arctic specialist at Rutgers University, said by email Wednesday.
“The Arctic warmth is the result of a combination of record-low sea-ice extent for this time of year, probably very thin ice, and plenty of warm/moist air from lower latitudes being driven northward by a very wavy jet stream.”
Francis has published research suggesting that the jet stream, which travels from west to east across the Northern Hemisphere in the mid-latitudes, is becoming more wavy and elongated as the Arctic warms faster than the equator does.
“It will be fascinating to see if the stratospheric polar vortex continues to be as weak as it is now, which favors a negative Arctic Oscillation and probably a cold mid/late winter to continue over central and eastern Asia and eastern North America. The extreme behavior of the Arctic in 2016 seems to be in no hurry to quit,” Francis continued.
Francis cited the work of Judah Cohen, a forecaster with Atmospheric and Environmental Research, who has linked odd jet stream behavior with cold air over Siberia.
Indeed, another Arctic expert, James Overland with the National Oceanic and Atmospheric Administration, said that the jet stream at the moment is well configured to transport warmth northward into the Arctic. “There is strong warm advection into the Arctic, especially northern-central Canada, in through the Atlantic, and east Siberian/Chukchi Sea,” Overland said.
The whole situation is pretty extreme, several experts agreed.
“Both the persistence and magnitude of these temperature anomalies are quite unusual,” Labe added by email. “Large variability in temperatures is common in the Arctic (especially during the cold season), but the duration of this warm Arctic — cold Siberia pattern is unusual and quite an impressive crysophere/sea ice feedback.” (The “cryosphere” refers to that part of the Earth’s system that is made up of ice.)
Abnormally warm air has flooded the Arctic since October. Richard James, a meteorologist who pens a blog on Alaska weather, analyzed 19 weather stations surrounding the Arctic Ocean and found that the average temperature was about 4 degrees (2 Celsius) above the record set in 1998.
Since November, temperatures have risen even higher. “It is amazing to see that the warmth has become even more pronounced since the end of October,” James wrote on his blog.
Mark Serreze, who heads the National Snow and Ice Data Center in Boulder, Colo., agrees that something odd is going on. Not only are air temperatures unusually warm, but water temperatures are as well. “There are some areas in the Arctic Ocean that are as much as 25 degrees Fahrenheit above average now,” Serreze said. “It’s pretty crazy.”
What’s happening, he explains, is sort of a “double whammy.” On the one hand, there is a “very warm underlying ocean” due to the lack of sea ice forming above it. But, at the same time, kinks in the jet stream have allowed warm air to flow northward and frigid Arctic air to descend over Siberia.
“The sea ice is at a record low right now, for this time of year, that’s one thing,” Serreze said. “And why it’s so low — again, there’s so much heat in the upper ocean in these ice-free areas, the ice just can’t form right now. The ocean’s just got to get rid of this heat somehow, and it’s having a hard time doing so.”

(NOAA)
The situation this winter could set the Arctic’s ice up for very thin conditions and a possible record low next year, Serreze said, although it’s too soon to say.
The weather in the Arctic can change swiftly. Temperatures could cool and the ice could rebound.
But the record-low sea ice extent and unprecedented warmth in the region fit in well with recent trends and portend even more profound changes in the coming years.
www.washingtonpost.com/news/energy-environment/wp/2016/11/17/the-north-pole-is-an-insane-36-degrees-warmer-than-normal-as-winter-descends/?utm_term=.ddeecee0d5a7
|
|
|
|
Post by swamprat on Nov 18, 2016 17:45:07 GMT -6
OK, one more for the Donald.....
Climate Change Already Impacting Most Processes On Earth Clark Mindock, International Business Times
11/16/2016

The effects of global climate change include more frequent wildfires, longer periods of drought in some regions and an increase in the number, duration and intensity of tropical storms. Credit: Left - Mellimage/Shutterstock.com, center - Montree Hanlue/Shutterstock.com.
Genes are changing. People are getting sick. Sea levels are rising. And that’s only part of the mounting impacts of climate change, a new study finds.
Over 80 percent of Earth’s ecological processes have already been hit by climate change, according to a study published Friday in Science Magazine from researchers in Hong Kong and Florida.
“Anthropogenic climate change is now in full swing, our global average temperature already having increased by 1 [degree] Celsius from pre-industrial levels,” the authors wrote in the paper.
Sea water levels have risen by almost 7.8 inches as ice has melted and oceans have expanded from that warming since 1870, the study notes. Those conditions led to flooding in low-lying coastal communities and displacement of fish populations fleeing warmer waters. As a result of those and other effects, 82 percent of the 94 ecological processes that were evaluated in the study appeared to be impacted by climate change.
"We now have evidence that, with only a roughly 1 degree Celsius of warming globally, major impacts are already being felt in natural systems," Dr. Brett Scheffers, a professor at the University of Florida and a lead author of the study, told Haaretz news. "Genes are changing, species' physiology and physical features such as body size are changing, species are moving and we see clear signs of entire ecosystems under stress, all in response to changes in climate on land and in the ocean."
While those impacts are being seen across the globe there is evidence that suggests living life on Earth may be slow to adapt to the challenges. Plant and animal species on Earth are known for their ability to adapt to changing environmental factors, but the rate at which climate change is taking hold may outpace the ability for wild plant species to change. That relatively slow rate of adaptation is pushing humans to try to genetically modify plants. In Israeli, researchers have been working to develop a more resilient apricot to survive in the warming climate.
When it comes to organisms on Earth that are actually thriving with changing climates, however, the outlook for humans isn't all great. Mosquitoes, for instance, which do well in warm and wet environments that are proliferating on the planet, are increasing the risk of mosquito-borne illnesses in areas where that risk was previously quite small.
Global levels of carbon dioxide in the atmosphere from humans burning fossil fuels have remained relatively stable over the last three years but have already reached a threshold considered to be dangerous by climate scientists. Scientists noted in September that a 400 part-per-million threshold of CO2 in the atmosphere, which was seen as a major milestone in combatting the impacts of a changing climate.
Forecasts for the future from the Intergovernmental Panel on Climate Change predict as much as a 2.5 to 10 degree Fahrenheit warming across the planet over the next century and temperatures from there are likely to continue to rise. That change in global temperature and climate will lead to more droughts and heat waves as well as changed precipitation patterns, stronger storm events like hurricanes and a 1-4 foot sea-level rise by 2100, according to the IPCC.
|
|
|
|
Post by swamprat on Nov 25, 2016 10:40:17 GMT -6
Hey, Donald!
Signs of climate change at Arctic tree lineBy EarthSky Voices in Earth
November 25, 2016
Near the Arctic Circle, in northern Alaska, is where forests give way to tundra. Researchers are looking at how the warming climate might affect the ecology of this northern boundary.
By Kevin Krajick. Reprinted with permission from State of the Planet
In northern Alaska’s Brooks Range, the earth as most of us know it comes to an end. From Fairbanks, the northernmost city on the North American road grid, drive up the graveled Dalton Highway. Unpeopled boreal forest stretches in all directions. About 200 miles on, you pass the arctic circle, beyond which the sun never sets in midsummer, nor rises in midwinter. Eventually, the trees thin out, and look scrawnier. The rolling landscape rises into big mountains, and you are threading through the bare, razor-edged peaks of the Brooks. Midway through the mountains, scattered spruces cling only to valley bottoms; further upslope is tundra, covered only with low-lying plants. At about 320 miles from Fairbanks, you pass the last little trees. Beyond lie the barren lands of the North Slope, ending at the industrial arctic-coast hamlet of Deadhorse and the oil fields of Prudhoe Bay—the only reason this road is here at all.

Near the arctic circle in northern Alaska, forests begin giving way to tundra. as cold air, frozen soils and lack of sunlight squeeze out trees. Researchers are investigating how warming climate may affect the ecology of this boundary. Photo via Kevin Krajick
The northern tree line, beyond which the climate is too harsh for trees to grow, circles all of earth’s northern landmasses for more than 8,300 miles. It is the largest ecological transition zone on the planet’s surface—a fuzzy boundary that actually loops north and south, and may appear gradual or sharp, depending on locale.
In the far north, climate is warming two to three times faster than the global average. As a result, both tundra and boreal forests are undergoing massive physical and biological shifts. But the details and the outlook remain unclear. Will warming cause forests to advance, pushing out the tundra? If so, how fast? Or will warming reduce the forests—and perhaps also tundra vegetation—by causing more wildfires and insect outbreaks? What will become of the countless birds and animals that depend on one or both environments? And will the huge amounts of carbon stored in the North’s frozen soils and its trees increase, or be released, to cause even more warming?

The tree line is the longest ecological transition zone on earth’s surface, circling through the northern landmasses of North America and Eurasia for some 8,300 miles. Here, the region beyond the trees is in red. At bottom right is Alaska, where researchers are now working in the area just beyond the arctic circle. Map courtesy of U.S. Fish and Wildlife Service.
To help answer these questions, scientists from Columbia University’s Lamont-Doherty Earth Observatory and other institutions are engaged in a long-term project to sort out what allows trees to survive or not in this borderline environment. They have set up monitoring plots, conveniently located along the highway, at the edge of the trees. Here, instruments will continuously measure air and soil temperature, precipitation, wind speed, humidity and other parameters for the next several years, and compare these with the growth and survival of trees. The fieldwork is part of the larger Arctic Boreal Vulnerability Experiment (ABoVE), a multiyear NASA-sponsored project that seeks to combine large-scale satellite observations of the northern regions with these fine-scale ground studies.

Natalie Boelman, an ecologist at Columbia University’s Lamont-Doherty Earth Observatory, measures the height of trees at one study plot. Image via Kevin Krajick.
Lamont-Doherty plant physiologist Kevin Griffin said:
"There are many conditions that affect whether trees can and cannot grow.
The main one is heat; trees generally are viable only where the mean growing-season temperature is above about 6.4 degrees C (about 43.5 degrees F). But that is not the whole answer," said Griffin.
"We also know it’s things like water, wind, nutrients, how much light is received, whether it’s direct or diffuse light, snow cover in the winter—it’s a complex combination. How that all works, that’s precisely what we’d like to find out."
Led by Jan Eitel, a forest scientist at the University of Idaho, the scientists arrived by pickup truck in early June to set up the plots. Almost no one lives between Fairbanks and Deadhorse, but they were able to put up at a lodge in the onetime gold-mining settlement of Wiseman, a mostly deserted huddle of cabins (current population about 20) dating from the early 1900s that lies near the highway. From here, the scientists commuted daily to a half-dozen sites, chosen for their sharp ecological edges; at each one, you could walk from the trees right into adjoining tundra, just slightly upslope. The most northerly plot is near a onetime modest landmark, the so-called Last Spruce, a starved-looking tree marked with a metal sign that said “Farthest North Spruce Tree on the Alaskan Pipeline – Do Not Cut.” A year or so ago, someone cut it down.

Trees grow very slowly here; this one that Boelman is examining is about 15 years old. Image via Kevin Krajick.
Part of the project involves mapping the sites with LiDAR, a surveying technology that shoots a pulsing laser to create an exquisitely detailed 3D landscape map. Accurate down to a few centimeters, it maps ground layout, individual tree branches and plant cover. In this environment, where trees are barely hanging on, the tiniest bits of variation in topography or temperature might make a life-or-death difference for a seedling; a bed of deep moss may swaddle it in warmth; a subtle swale, projecting boulder or another tree might protect it from raking winds.
But most far northern soils are permanently frozen just below the surface, and warming climate is not altering the fearfully small amount of light reaching plants much of the year. A neighboring tree might also cast just enough shade so that a seedling cannot get enough light and warmth, and a too-dense stand of trees might reduce the overall soil temperature they themselves need for rooting and uptake of nutrients. The surveys, repeated every few days by automated cameras, are designed to show how the landscape changes over time.
See next post for page 2
|
|
|
|
Post by swamprat on Nov 25, 2016 10:45:20 GMT -6
Page 2 Shrubby deciduous dwarf willows and aspens grow here, but the only real trees this far north are the spruces. Once one takes root, it grows slowly—very slowly. One day University of Idaho remote-sensing specialist Lee Vierling and Lamont ecologist Natalie Boelman aged some smaller ones by counting whorls—the bit of stem that sprouts from the top each growing season. One Christmas-tree size spruce reaching just over their heads turned out to be 96 years old; it had apparently started growing in 1920. Vierling said:
Woodrow Wilson was president then. World War I was just over. The tallest trees reach 20 to 30 feet, a height that spruces can reach in a decade or two further south; these have probably stood for 200 to 300 years."

Lamont-Doherty plant physiologist Kevin Griffin checks an instrument designed to monitor a spruce tree’s photosynthetic activity. Image via Kevin Krajick.
Warmer weather is almost certain to make these trees grow faster, and such weather is already here. With 24-hour daylight, the team worked up to 14 hours a day, much of the time sweating in intense sun. Around this time, the thermometer up at Deadhorse hit an all-time record of 85 degrees F—identical to New York’s Central Park that same day.
The team’s hostess in Wiseman, Heidi Schoppenhorst, has lived here her whole life. She said:
"The trees are really booming here. The climate is warming, and there’s more rain in June, when it really matters."
There is already evidence from satellite imagery that the tundra beyond is becoming greener and shrubbier. Many scientists expect the tree line to advance eventually, and some studies purport to show that this is already happening. Some models predict that half the current tundra could be converted by 2100, though others say the process would be much slower. On the other hand, some studies assert the trees are actually retreating in areas, as heat dries forests, helping invasive insects and fires to destroy growing areas.
In Alaska, fires are predicted by one study to grow fourfold in coming decades, and it is already being ravaged; on the way up, the scientists passed through several big tracts reduced in the past few years to blackened sticks. This year a fire around Fort McMurray, in northern Alberta, drove out 80,000 residents and leveled part of the city. A few years ago, Boelman was part of a team that studied a 2007 lightning-sparked fire that burned 400 square miles of tundra on the North Slope — the biggest tundra fire ever recorded, in an area where thousands of years may go by without any fire at all.

Team leader Jan Eitel of the University of Idaho sets up a solar-powered radar camera that will scan a study site continuously for years, to capture how trees respond to changing conditions. Image via Kevin Krajick.
Stroking the needles of a nearby spruce about up to her shoulder, but probably much older than she is, Boelman said:
"The differences between tundra and trees are really interesting, especially since one is predicted to start encroaching on the other."
Boelman is part of a separate ABoVE project in which researchers are radiotagging northern animals including caribou, bears, moose, wolves and eagles, to see where they travel in relation to changing fire and weather conditions. Boelman has been working in northern Alberta tagging American robins, which are known to inhabit wide ranges and migrate vast distances. If anecdotal evidence means anything, the trend could be northward; in the last 20 years, some Inuit communities who had never seen robins before have had to invent a name for them: “Koyapigaktoruk.”

On her first trip to the north, Lamont-Doherty graduate student Johanna Jensen takes down data on a wired-up spruce. The study will provide not only long-term information on climate change, but opportunities for young scientists to work directly in the field. Image via Kevin Krajick.
A few days after installing complex arrays of sensors, cameras and data loggers, along with solar panels and tangles of wires to connect them, the scientists discovered an unexpected wildlife phenomenon: Rabbits, rampant in the forest, loved chewing through the wires, and their equipment was blinking out. The team quickly made repairs and improvised defenses, burying the wires in spongy moss or surrounding them with palisades of sharp, dead sticks. Plans were laid for obtaining chicken wire for a more permanent solution.
Rabbits do not thrive like this in tundra, but if the trees and shrubs move northward, the rabbits will probably move with them. So will other creatures that favor such habitats, such as lynx, moose, black bears and white-crowned sparrows. Those who favor tundra would then have to adapt or get nudged out; these include musk oxen and open-area nesting birds such as Lapland longspurs and ptarmigans. Some animals, including barren-ground caribou and wolves, move seasonally between the two.
Boelman is neutral about the outcome:
"People assume that when the ecosystem changes, it’s going to be all bad. But with climate change, there are almost always winners and losers. Some species will suffer, but others will benefit."
Along the Dalton Highway itself, change is happening fast. Near the study sites, workers were digging an endless ditch to lay a fiber-optic line to Deadhorse. Intrepid tourists, encouraged by the mild weather, passed by in heavily laden vehicles and waved. A man pushing a large stroller-type contraption southward was said to be on a mission to walk from Deadhorse to Austin, Texas. Giant trucks raced northward carrying cable, pipes, prefab buildings. Some were carrying gasoline, against the pipeline flow of oil going in the opposite direction. The fossil-fuel circle was being completed; refined energy was heading back to help keep up the production of raw energy.
NOTE: There is a video located at the top of the article at this URL: earthsky.org/earth/decoding-climate-change-signals-arctic-treeline-tundra-alaska |
|
|
|
Post by swamprat on Nov 25, 2016 11:10:59 GMT -6
Weather vs. Climate: Why Trump's Global Warming Stance Is FlawedBy Laura Geggel, Senior Writer
November 23, 2016
Is there reason to doubt climate change because some of the nation's hottest days happened in 1898, as President-elect Donald Trump told the New York Times in an interview yesterday?
In an exchange with Times publisher Arthur Sulzberger Jr. and staff about climate change on Tuesday (Nov. 22), Trump said, "I have an open mind to it," but later added, "You know the hottest day ever was in 1890-something, 98. You know, you can make lots of cases for different views."
However, it's misleading to single out a weather event — such as a particularly hot day in 1898 — as evidence for or against climate change, according to the National Oceanic and Atmospheric Administration's National Ocean Service (NOS).
"Weather is what you see outside on any particular day," the NOS reports. "So, for example, it may be 75 degrees and sunny or it could be 20 degrees with heavy snow."
In contrast, climate is an average of weather over time. "For example, you can expect snow in the Northeast in January, or for it to be hot and humid in the Southeast in July," the NOS said.
Extreme values, such as record rainfall or record high and low temperatures, are known as climate records because they stand out in a long period of time, the agency added.
In 1898, both Oregon and Maryland reached their highest temperatures on record: 119 degrees Fahrenheit (66 degrees Celsius) in Oregon and 109 F (60.5 C) in Maryland, according to The Weather Channel. But these record-hot temperatures are simply climate records in two states, not evidence for widespread climate change, according to experts.
Rather, looking at the climate for an extended period of time gives researchers a better idea about the direction the climate is heading. For instance, 2016 is expected to be the hottest year on record by a significant margin, with world temperatures an average of 2.2 F (1.2 C) above preindustrial levels, the World Meteorological Organization (WMO) said, as reported by Climate Central.
Moreover, 2011 to 2015 is the hottest five-year period on record, according to a separate WMO report released this month, according to Climate Central. When 2016 officially becomes the hottest year on record, 16 of the 17 hottest years will have happened since 2000, with the El Niño year of 1998 being the only exception, Climate Central reported.
Ninety-seven percent of climate scientists agree that this rapid warming is not due to natural causes, but due primarily to the result of human activity, according to NASA.
These increasing temperatures are "consistent with our expectations for the response of the climate system to increases in greenhouse gases," Jennifer Francis, a research professor in the Department of Marine and Coastal Sciences at Rutgers University in New Jersey, told Live Science last week.
During the interview with Trump, Sulzberger also conflated a single weather event — Hurricane Sandy, which slammed the Caribbean and the East Coast of the United States in 2012 — with climate change, saying, "Well, since we're living on an island, sir, I want to thank you for having an open mind. We saw what these storms are now doing, right? We’ve seen it personally. Straight up."
However, there is debate about whether Hurricane Sandy was a consequence of climate change. In general, scientists are hesitant to say that climate change caused the 2012 hurricane, but some say that climate change contributed to it, Live Science reported in 2012.
For instance, warm oceans and moist air give strength to existing hurricanes, Kevin Trenberth, a distinguished senior scientist in the Climate Analysis Section at the National Center for Atmospheric Research, told Live Science.
Moreover, it's possible that future flood-causing surges from hurricanes and other storms will be more severe as climate change causes sea levels to rise, according to study published in October in the journal Proceedings of the National Academy of Sciences.
www.livescience.com/56992-trump-difference-between-weather-and-climate.html
|
|
|
|
Post by swamprat on Nov 29, 2016 10:40:10 GMT -6
Australia's Great Barrier Reef suffers worst ever coral bleaching By Ben Westcott, CNN
November 29, 2016
(CNN)Coral across Australia's Great Barrier Reef has suffered its most devastating die-off on record, a new report says.

Dramatic coral bleaching, seen in Australia's Great Barrier Reef from March 2016
In just nine months, bleaching caused by warmer water has killed around 67% of the coral in a previously pristine part of the reef, one of the natural wonders of the world.
"We've seen three bleaching events (in the reef) and each time it can be explained by where the warm water was," the report's author, ARC Center of Excellent for Coral Reef Studies Director Terry Hughes, told CNN.
"In the north, the summer temperatures got up to two degrees above the normal maximum and that caused severe bleaching," he said.
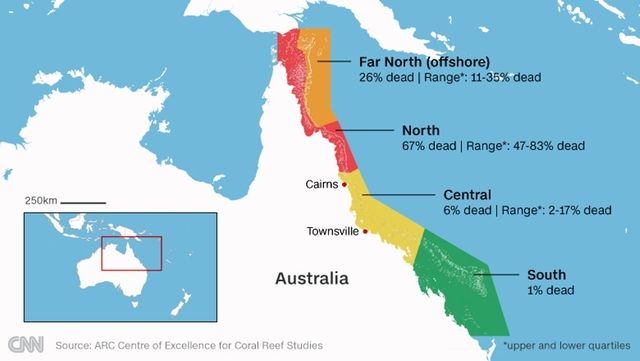
Extensive aerial surveys and teams of divers were used to map the bleaching, which covered a length of 700 kilometers.
Hughes said it could take up to 15 years for coral to grow back to previous levels.
Threats to the reef have become so severe that in recent years UNESCO has suggested it could be placed on list of World Heritage sites "in danger."
A spokesman for Australia's Environment Minister Josh Frydenberg said a report on the status of the Great Barrier Reef to UNESCO was due by Friday, local time.
A decision on whether or not the reef will be declared "in danger" is expected within the next year, the spokesman added.
Most severe bleaching event yet
Two major coral bleaching events in the Great Barrier Reef took place in 1998 and 2002, but Hughes said this year's had been the most devastating.
"It's quite sobering, we've now seen three of these events, each one was more severe than the last and these have occurred with less than one degree of global warming," he said.
"Two degrees of global warming will mean these events are more severe."
Although the coral is expected to regrow, Hughes said a fourth or fifth major bleaching event in the next 15 years could damage the reef even further.
"It's too unpredictable for anyone to be sure when the next event will occur," he said.
Northern reef used to be 'pristine'
While the northern parts of the reef were damaged severely by the bleaching event, others survived almost entirely intact.
The Great Barrier Reef's southern third only suffered about 1% bleaching on average, the report said, mostly due to the arrival of Cyclone Winston in February this year.
"It brought temperatures in the bottom half of the reef down and saved it from what would have been a reef-wide bleaching event," Hughes said.
Hughes said the northern sections had previously been among the most pristine in the entire Great Barrier Reef, remaining untouched while the southern regions saw their coral drop by half in the past 30 years.
"It's hard to get to, so it's the part where there are more sharks, more crocodiles, more turtles, more coral. Unfortunately the 67 per cent loss we've detected means that pristine northern part is now in a worse condition than the lower part," he said.
www.cnn.com/2016/11/28/asia/great-barrier-reef-coral-death/index.html
|
|
|
|
Post by swamprat on Dec 1, 2016 13:06:34 GMT -6
|
|
|
|
Post by skywalker on Dec 1, 2016 23:03:24 GMT -6
That article makes more sense than most of the silly climate change stuff I have been reading lately.
|
|
|
|
Post by swamprat on Dec 6, 2016 10:37:52 GMT -6
Extreme rainfall risks could triple in the U.S. under climate change, scientists warnBy Chelsea Harvey
December 5, 2016
U.S. residents may want to start preparing for a stormier future, scientists say. According to a new study, future climate change could cause an increase in extreme precipitation events throughout much of the country — in fact, these events could become up to five times more frequent in some areas.
It’s an outcome many climate scientists have already predicted for the planet as a whole, according to Andreas Prein, a scientist at the National Center for Atmospheric Research and the new study’s lead author.
“We expect that intense rainfall extremes will get more frequent and more intense in the future climate because if we warm up the atmosphere, air can hold more moisture,” he said. In fact, he added, records from the past few decades indicate that we’re already seeing this effect in the warming United States.
“What we were interested in is how these kinds of storms might change in the future,” Prein said.
The new study, published Monday in the journal Nature Climate Change, investigated the relationship between rising temperatures and precipitation throughout the lower 48 states. Using special climate models, the researchers simulated precipitation across the continent under both current climate conditions and a hypothetical high-warming, or “business-as-usual,” scenario.
They found that the way warming affects precipitation depends a lot on humidity — the amount of moisture that’s available in the air to begin with. In moist locations, rising temperatures tend to cause an increase in extreme precipitation, while the opposite can be true in drier places. In general, there tends to be a “sweet spot” in terms of the temperature that produces the most extreme precipitation events on average in the United States, Prein said — currently, it’s about 80 degrees Fahrenheit.
But, he noted, the study suggests that “in the future climate, storms keep on intensifying up to something like 87 or 88 degrees Fahrenheit.”
This is because under future climate change, many parts of the nation will become both warmer and wetter. As a result, much of the country will see an increase in both the frequency and intensity of extreme precipitation events. This is especially true for parts of the Gulf and Atlantic coasts, as well as some mountain regions like the Rockies, where humidity is high to begin with. On average across the U.S., extreme precipitation events may become nearly three times more likely, according to Prein. And at highest, their frequency may increase five-fold in some locations. One way to think about this is to imagine the most intense storm of the summer, Prein said. In the future, a storm of that magnitude might occur five times in a season instead of just once.
The researchers expect the intensity of these events, or the amount of precipitation they produce, to spike as well — by as much as 70 percent in some cases. This means a storm that produced three inches of rain in the past, for example, might produce more than five inches in the future.
This could be a problem for communities across the country in the future, who may need to start thinking about updating their infrastructure to deal with a future uptick in extreme storms. But there’s still hope: The new study relies on a business-as-usual scenario, meaning a situation in which current warming rates continue unabated into the future. With a serious effort at cutting greenhouse gas emissions and slowing the progression of climate change, these situations could still be avoided.
So the new study serves as a warning of what could happen in the future, but not necessarily a definite forecast.
“If we can manage to level out temperature increases at a lower rate than what we see here…then the consequences will be less,” Prein said.
www.washingtonpost.com/news/energy-environment/wp/2016/12/05/extreme-rainfall-risks-could-triple-in-the-u-s-under-climate-change-scientists-warn/?utm_term=.72fb221b2d44
See science paper here:www.nature.com/nclimate/journal/vaop/ncurrent/full/nclimate3168.html
|
|
|
|
Post by swamprat on Dec 6, 2016 19:25:44 GMT -6
|
|
|
|
Post by swamprat on Dec 7, 2016 20:59:53 GMT -6
|
|
|
|
Post by swamprat on Dec 9, 2016 14:34:52 GMT -6
|
|
|
|
Post by swamprat on Dec 12, 2016 12:11:15 GMT -6
Ice loss spreads up Antarctic glaciersBy Jonathan Amos BBC Science Correspondent, San Francisco
12 December 2016
The scale and pace of change now taking place in West Antarctica is captured in a new, long-term satellite record.
Scientists have combined nearly a quarter of a century of observations to show how the region's great glaciers are losing height by up to 7m per year.
The satellite data also traces the way this thinning behaviour has spread up the length of the ice streams.
The glaciers concerned all terminate in the Amundsen Sea and are significant contributors to global ocean rise.
Their names are Pine Island, Thwaites, Pope, Smith, and Kohler.
Right now, they are dumping some 120 to 140 billion tonnes of ice a year into the ocean, which is sufficient to push up global waters by between 0.34mm and 0.40mm per annum - more than 10% of the total worldwide trend.
The glaciers' reduction in height is likely the result of the warm seawater recorded around Antarctica in recent decades.
This attacks the underside of the ice streams at the point where they cease to push out along bedrock and begin to float. Eroding this "grounding line" back towards the land makes the glaciers move faster.
"As the glaciers accelerate, they have to take ever more ice from the interior to compensate for the speed-up. This means they thin; they lose height, which we can detect from space," explained Dr Hannes Konrad from the UK's Centre for Polar Observation and Monitoring (CPOM).
"And if there is no increase in snow and ice in the interior then this thinning will just migrate further and further upstream," the Leeds University researcher told BBC News.
Dr Konrad is presenting his team's work here at the Fall Meeting of American Geophysical Union (AGU) - the world's largest annual gathering of Earth scientists.
His study has also just been accepted for publication in the journal Geophysical Research Letters.
It seamlessly ties together for the first time the altimetry observations from five different satellites operated by the European and American space agencies from 1992 to the present day.
What is interesting in the data is the individual responses of the glaciers to the melting assault.
They all show thinning over the period, but the behaviours are far from uniform.
Pine Island Glacier (PIG), which currently contributes more to sea level rise than any other ice stream on the planet, thins fairly steadily and relentlessly.
The lowering of its surface is already in play by the start of the satellite measurements, and now spreads back from its grounding line, along its main trunk for hundreds of km inland.
At maximum, the glacier is losing 5m in height every year and the thinning spreads inland at up to 15km per year at times.
Thwaites, on the other hand, started dropping its elevation later than the PIG and did so in two broad periods. Its delayed and episodic response means thinning on Thwaites has not spread so far inland.
Pope, Smith, and Kohler very likely began thinning earlier even than the PIG and show the sharpest height loss - up to 7m per year at the grounding line. But this behaviour is much slower to spread back along the glaciers' trunks.
"They are much smaller than the PIG or Thwaites. They have small catchments and flow along short, narrow troughs in the bedrock. So they have a very limited area where the thinning can spread into," explained Dr Konrad.
The study's results will be used to calibrate models that try to forecast the behaviour of the Amundsen Sea region in a warming world, and the consequences this will have for future sea-level rise.
It has been argued that this part of Antarctica may already be in an unstoppable retreat which would see its glaciers all collapse in coming centuries.
But co-author Prof Andrew Shepherd said there remains a good deal of uncertainty in the projections.
"It's clear from this study that the response of these glaciers to environmental change has not been uniform," he told BBC News.
"Thinning stopped and started on Thwaites, and it spread at different rates down each of glaciers.
"We have to treat these glaciers as individuals - not as a unit - if we want to make better projections of future sea-level rise."
Prof David Vaughan from the British Antarctic Survey was not involved in the study, but commended its insight - "the first time anyone's properly tracked these changes and how they propagate inland".
Scientists needed now to fully explain the different behaviours, he added.
Much research effort has already been focused on Pine Island, and Thwaites is about to get similar treatment with big UK-US field campaigns planned for the Antarctic seasons of 2019-20 and 2020-21.
"Of all these glaciers that are retreating, Pine Island has accelerated the most and is currently the furthest out of balance, but ultimately it is Thwaites in the long term, in the hundred-year timescale, that is seen as being the big concern. Because of its geometry, because the middle of its central basin just gets deeper and deeper - once you kick off its retreat, there maybe nothing to stop it."
www.bbc.com/news/science-environment-38256932
Oh, but "Global Warming" is a myth, right?!!  
|
|
|
|
Post by swamprat on Dec 14, 2016 19:38:09 GMT -6
Mysterious 'Crater' in Antarctica Has Ominous CauseBy Stephanie Pappas, Live Science Contributor
December 14, 2016
A "crater" in Antarctica once thought to be the work of a meteorite impact is actually the result of ice melt, new research finds.
The hole, which is in the Roi Baudouin ice shelf in East Antarctica, is a collapsed lake — a cavity formed when a lake of meltwater drained — with a "moulin," a nearly vertical drainage passage through the ice, beneath it, researchers found on a field trip to the area in January 2016.
"That was a huge surprise," Stef Lhermitte, an earth science researcher at Delft University of Technology in the Netherlands and at the University of Leuven in Belgium, said in a statement. "Moulins typically are observed on Greenland. And we definitely never see them on an ice shelf."
Surprising melt
Combining their fieldwork with satellite data and climate modeling, the researchers found that East Antarctica is more vulnerable to melt than was previously realized. Warm winds to the region blow away the snow cover, which darkens the surface of the ice, the team reported Dec. 12 in the journal Nature Climate Change. Darker surfaces absorb more heat from the sun than lighter surfaces, so they are more prone to melt. These floating ice sheets don't contribute much to sea level rise ¬— as they're already in the ocean — but they provide an important backstop against the flowing of land-based ice from continental Antarctica into the ocean.
East Antarctica has been a mysterious place when it comes to climate change. The region has been gaining ice due to increases in snow accumulation, according to 2015 research. Global warming can increase snowfall by boosting the amount of moisture in the air (warm air holds more moisture than cold).
The Roi Baudouin crater was more mysterious still. It's existed on satellite images going back to at least 1989, researchers said, but was first noted widely in January 2015. Scientists initially reported it to be a meteorite crater, perhaps the result of a space rock that exploded over Antarctica in 2004. But scientists quickly questioned whether the 2-mile-wide (3 kilometers) circle was really from a meteorite. Many suspected it was the result of melting ice.
Jan Lenaerts, a climate researcher at Utrecht University in the Netherlands and at the University of Leuven, was one of the meteorite skeptics.
"My response was: 'In that area? Then it's definitely not a meteorite; it's proof of strong melting,'" he said in a statement.
Vulnerable ice
The new study confirms that hunch. During their fieldwork on the southernmost continent, researchers also discovered many other meltwater lakes beneath the surface of the Roi Baudouin ice sheet.
"The amount of meltwater differs immensely from year to year, but it clearly increases during warm years," Lhermitte said.
Earlier research had shown that West Antarctica is very sensitive to climate change, Lenaerts said in the statement.
"Our research now suggests that the much larger East Antarctica ice sheet is also very vulnerable," Lenaerts said.
www.livescience.com/57204-mysterious-crater-in-antarctica-explained.html?utm_source=ls-newsletter&utm_medium=email&utm_campaign=20161214-ls
|
|
|
|
Post by swamprat on Dec 21, 2016 12:31:59 GMT -6
Now THIS scares the heck outta me! Let's hope and pray the scientists will have some impact on these idiots people!US Earth scientists plan for uncertain future under TrumpConcerned by president-elect’s choice of advisers, researchers take steps to defend their fields.
Jeff Tollefson & Alexandra Witze
20 December 2016
Incoming US president Donald Trump’s government is beginning to take shape, and Earth scientists are getting nervous.
Trump’s latest Cabinet appointments include former Texas governor Rick Perry, a climate sceptic, for energy secretary, and ExxonMobil chief executive Rex Tillerson for secretary of state — a position that would make him the United States’ lead emissary on climate change. The pair helps to fill out a roster of advisers with strong ties to industry and a distaste for government regulation. Trump’s transition team also asked the Department of Energy (DOE) for the names of employees who had worked on climate-change issues, further unsettling researchers.
“It feels like a war on science, and on climate science in particular,” says Alan Robock, a climatologist at Rutgers University in New Brunswick, New Jersey. “That’s very upsetting.”
Scientists won a small battle on 14 December, when Trump’s team disavowed the memorandum it sent to the DOE seeking information on climate-change programmes. The request sparked widespread outrage and drew a rebuke from the department after it was leaked on 9 December. At the Fall Meeting of the American Geophysical Union (AGU) last week in San Francisco, California, some researchers billed the episode as a blueprint for how they might defend their interests after Trump takes office on 20 January.
“There is power, even with an administration that never admits a mistake, in bringing things to light,” says Andrew Rosenberg, who heads the Center for Science and Democracy at the Union of Concerned Scientists in Cambridge, Massachusetts.
Other researchers are copying government climate-data sets, to preserve them in case the Trump administration and the Republican-controlled Congress follow through on proposals to cut back Earth-science research at NASA or otherwise restrict studies of global warming. One rescue effort had archived 11 of 91 data sets on its list for preservation as of 16 December; these include a global temperature record maintained by NASA and palaeoclimate archives held by the National Oceanic and Atmospheric Administration (NOAA).
Marcia McNutt, president of the US National Academy of Sciences, says that private foundations have expressed interest in “funding up to the order of billions of dollars” for climate-change research if the Trump administration reduces support for such work. But McNutt — who directed the US Geological Survey (USGS) from 2009 to 2013 — is not ready to give up on government science. “I don’t want that to be an excuse for the government to pull away — to say private philanthropy can do this, the government doesn’t need to fund it,” she told journalists at the AGU meeting.
The road ahead for scientists looks tough. Perry dealt with energy issues as governor of Texas, but he lacks experience with key areas of the DOE portfolio, says John Deutch, a chemist at the Massachusetts Institute of Technology in Cambridge. Deutch, who leads the department’s advisory board, says that Trump should identify a deputy energy secretary who understands the agency’s programmes on basic science, nuclear weapons and national security.
And Perry is not the only climate sceptic poised to join Trump’s inner circle. Trump’s pick to lead the US Environmental Protection Agency is Oklahoma attorney-general Scott Pruitt, who has sued the federal government to overturn greenhouse-gas and air-quality rules.
The president-elect has not announced whom he would like to run NASA, NOAA or the USGS, among other science agencies. McNutt says that the National Academies of Science, Engineering, and Medicine have provided his transition team with a list of potential candidates, but none of those people has been contacted by Trump staff.
Some scientists argue that even if policies to fight climate change are weakened or struck down under Trump, his latest nominations hint that there may be ways to promote clean energy. Tillerson has said that a carbon tax is the best way to address global warming. And although Perry is a strong proponent of fossil fuels, Texas’s wind-power production grew significantly during his governorship.
“Those are places to insert a progressive agenda into an otherwise kind of ugly and cloudy landscape,” says Daniel Kammen, an energy researcher at the University of California, Berkeley.
McNutt advises scientists to stay clear-eyed as they confront whatever challenges the Trump administration brings. “I see so many people in this country freaked out,” she says. “That is exactly what those who want to disrupt science are hoping to achieve.”
www.nature.com/news/us-earth-scientists-plan-for-uncertain-future-under-trump-1.21213?WT.ec_id=NEWSDAILY-20161221
|
|
Deleted
Deleted Member
Posts: 0
|
Post by Deleted on Dec 21, 2016 12:40:26 GMT -6
And Perry is not the only climate sceptic poised to join Trump’s inner circle. Trump’s pick to lead the US Environmental Protection Agency is Oklahoma attorney-general Scott Pruitt, who has sued the federal government to overturn greenhouse-gas and air-quality rules. Read more: theedgeofreality.proboards.com/thread/5864/global-cooling#ixzz4TV1B5Y6o**** Now to look to see if Pruitt won his suit ...... |
|
Deleted
Deleted Member
Posts: 0
|
Post by Deleted on Dec 21, 2016 12:44:47 GMT -6
McNutt advises scientists to stay clear-eyed as they confront whatever challenges the Trump administration brings. “I see so many people in this country freaked out,” she says. “That is exactly what those who want to disrupt science are hoping to achieve.” Read more: theedgeofreality.proboards.com/thread/5864/global-cooling?page=1#ixzz4TV1bXj7e***** THIS has been on-going since I was born (1966). And it's been more than humans disrupting scientific study. Time to quit playing "stoop-id". |
|
|
|
Post by skywalker on Dec 29, 2016 18:55:19 GMT -6
|
|
|
|
Post by lois on Jan 2, 2017 0:19:38 GMT -6
There is more evidence for it than against it. I don't believe this article . You will be hearing a lot of this since Republicans rule. We are hurting this planet in a hundred different ways and someday the bubble will pop. Trump has hired debunkers just to turn it around . Well it won't work. Clean air Clean energy or the planet will warm |
|
|
|
Post by swamprat on Jan 2, 2017 8:51:43 GMT -6
The Year in Climate Change: 2016's Most Depressing Stories  By Kacey Deamer, LiveScience Staff Writer By Kacey Deamer, LiveScience Staff Writer
December 27, 2016
On social media, 2016 has jokingly been called "the year on fire," and in terms of climate change, it was. Though there were some environmental successes this year, such as the Paris climate agreements becoming law, 2016 had some very depressing headlines regarding global warming and the planet's overall environmental health. Here is some of the most dismal news to come out of "the year on fire."
www.livescience.com/57308-depressing-global-warming-stories-of-2016.html
|
|
|
|
Post by jcurio on Jan 2, 2017 13:07:45 GMT -6
The pair helps to fill out a roster of advisers with strong ties to industry and a distaste for government regulation. Read more: theedgeofreality.proboards.com/thread/5864/global-cooling#ixzz4UdHRTk83------------- Cannot have it "both ways", folks. 😇 My "prediction" (not prophecy) is that after "being in office" a short, short period of time, we will see certain people "changing their tune". Good or bad? 😉 |
|
|
|
Post by jcurio on Jan 3, 2017 0:26:36 GMT -6
|
|
|
|
Post by swamprat on Jan 4, 2017 18:02:30 GMT -6
...and no, NASA is not "cooking the books". 
Forget About A Global Warming "Pause" — It Doesn't ExistBy Laura Geggel, Senior Writer
January 4, 2017
Forget about the so-called climate change hiatus — a period beginning in 1998 when the increase in the planet's temperature reportedly slowed — it doesn't exist, according to a new study that found the planet's ocean temperatures are warming faster than previously thought.
The findings support similar results from a 2015 study published by the National Oceanic and Atmospheric Administration (NOAA) in the journal Science. However, doubters of climate change attacked that study, prompting the researchers of the new study to examine the data anew.
"Our results mean that essentially NOAA got it right, that they were not cooking the books," study lead author Zeke Hausfather, a graduate student at the University of California, Berkeley's Energy and Resources Group.
Climate change hiatus
The climate change hiatus was more of a suspected "slowdown, not a disappearance of global warming," as the world's oceans were still warming, but at a lesser rate than previously predicted, according to Climate Central. However, many scientists acknowledged the slowdown, which allegedly took place from 1998 to 2012. Climate change doubters also took note, and used the slowdown as evidence that climate change was a hoax, the researchers of the new study said.
But in 2015, NOAA published an analysis showing that the slowdown wasn't real, and was the result of measurement errors. The modern buoys that measure ocean temperatures tend to report slightly cooler temperatures than older ship-based systems, even when measuring the same part of the ocean, the NOAA researchers found.
That's because in the 1950s, ships began to measure water piped through the engine room, which is usually a warm place. In contrast, today's buoys report slightly cooler temperatures because they measure the water directly from the ocean, Hausfather said.
"The observations have gone from 80 percent ship-based in 1990 to 80 percent buoy-based in 2015," the researchers wrote in the study. As this switch happened, it appeared that there was a warming slowdown in the ocean — largely because researchers didn't account for the ships' warm bias when combining the buoy and ship data sets.
When the NOAA researchers corrected for the bias, they found that the oceans had warmed 0.22 degrees Fahrenheit (0.12 degrees Celsius) per decade since 2000, a rate almost twice as fast as earlier estimates of 0.12 F (0.07 C) per decade. Moreover, the newfound rate matched estimates for the previous 30 years, from 1970 to 1999, the researchers said.
But once the NOAA study was published, a U.S. House of Representatives committee subpoenaed the scientists' emails, said Hausfather, who was not involved in the 2015 study. NOAA provided data and responded to scientific questions, but did not comply with the subpoena, as many said it would have a "chilling effect" on science, according to a UC Berkeley statement.
Independent study
In order to see whether the NOAA researchers got it right, Hausfather and his colleagues took an independent look at ocean temperatures by using data from satellites, robotic floats (called Argo floats) and buoys.
The approach is different than the one the NOAA took, which was an attempt to combine the old ship measurements with data from new buoys.
"Only a small fraction of the ocean measurement data is being used by climate monitoring groups, and they are trying to smush together data from different instruments, which leads to a lot of judgment calls about how you weight one versus the other, and how you adjust for the transition from one to another," Hausfather said in the statement. "So we said, 'What if we create a temperature record just from the buoys, or just from the satellites, or just from the Argo floats, so there is no mixing and matching of instruments?'"
In every scenario — whether the data was from the satellites, buoys or the Argo floats— the researchers found that the warming ocean trends matched those found in the NOAA study. Their findings provide more evidence that the oceans have warmed 0.22 F per decade over the past 20 years, the researchers said.
In other words, the rising trend in temperatures is seen in the last half of the 20th century and continued through the first 15 years of the 21st, meaning there was no hiatus, the researchers said.
"In the grand scheme of things, the main implication of our study is on the hiatus, which many people have focused on, claiming that global warming has slowed greatly or even stopped," Hausfather said. "Based on our analysis, a good portion of that apparent slowdown in warming was due to biases in the ship records."
Correcting biases
Last year, NOAA published another study in the journal Science, which gave more weight to temperature measurements collected by buoys than by ships. NOAA also accounted for changing shipping routes and measurement techniques, all of which are valid ways to correct for measurement biases, the researchers of the new study said.
Hausfather and his colleagues are urging researchers who study ocean temperature trends to take the new data into account. For instance, the Hadley Climatic Research Unit in the United Kingdom, another repository of oceanic temperatures, didn't completely account for the measurement changes, and so their data show a slightly lower rate of warming than the NOAA and the new study's results, Hausfather and colleagues said.
"In the last seven years or so, you have buoys warming faster than ships are, independently of the ship offset, which produces a significant cool bias in the Hadley record," Hausfather said. In the new study, the researchers urge the Hadley center to fix this bias, he said.
"People don't get much credit for doing studies that replicate or independently validate other people's work," Hausfather said. "But, particularly when things become so political, we feel it is really important to show that, if you look at all these other records, it seems these researchers did a good job with their corrections."
Study co-author Mark Richardson, a climate scientist at NASA's Jet Propulsion Laboratory and the California Institute of Technology in Pasadena, agreed.
"Satellites and automated floats are completely independent witnesses of recent ocean warming, and their testimony matches the NOAA results," Richardson said. "It looks like the NOAA researchers were right all along."
The study was published online today (Jan. 4) in the journal Science Advances.
www.livescience.com/57378-global-warming-hiatus-not-happening.html
|
|
|
|
Post by swamprat on Jan 5, 2017 11:27:31 GMT -6
Will someone PLEASE convince Trump and Pruitt! Anyone who thinks we can nourish, protect, and provide energy to an ever-growing/developing world population without big strides in technology is, uh, intellectually challenged.....
Tenfold jump in green tech needed to meet global emissions targetsGreen innovations must be developed and spread globally 10 times faster than in the past if we are to limit warming to below the Paris Agreement's 2 degrees C target
Date: January 3, 2017
Source: Duke University
Summary: The global spread of green technologies must quicken significantly to avoid future rebounds in climate-warming emissions, a new study shows. Based on the new calculations, the Paris Agreement's warming target of 2 degrees C won't be met unless clean technologies are developed and implemented at rates 10 times faster than in the past. Radically new strategies to implement technological advances are needed.

Models of future CO2 emissions and temperature changes show the Paris Agreement's warming target of 2oC won't be met unless clean technologies are developed and implemented at rates 10 times faster than in the past to avoid future CO2 emissions. Credit: Duke University
The global spread of green technologies must quicken significantly to avoid future rebounds in greenhouse gas emissions, a new Duke University study shows.
"Based on our calculations, we won't meet the climate warming goals set by the Paris Agreement unless we speed up the spread of clean technology by a full order of magnitude, or about ten times faster than in the past," said Gabriele Manoli, a former postdoctoral associate at Duke's Nicholas School of the Environment, who led the study.
"Radically new strategies to implement technological advances on a global scale and at unprecedented rates are needed if current emissions goals are to be achieved," Manoli said.
The study used delayed differential equations to calculate the pace at which global per-capita emissions of carbon dioxide have increased since the Second Industrial Revolution -- a period of rapid industrialization at the end of the 19th century and start of the 20th. The researchers then compared this pace to the speed of new innovations in low-carbon-emitting technologies.
Using these historical trends coupled with projections of future global population growth, Manoli and his colleagues were able to estimate the likely pace of future emissions increases and also determine the speed at which climate-friendly technological innovation and implementation must occur to hold warming below the Paris Agreement's 2o C target.
"It's no longer enough to have emissions-reducing technologies," he said. "We must scale them up and spread them globally at unprecedented speeds."
The researchers published their peer-reviewed findings December 29 in the open-access journal Earth's Future.
The analysis shows that per-capita CO2 emissions have increased about 100 percent every 60 years -- typically in big jumps -- since the Second Industrial Revolution. This "punctuated growth" has occurred largely because of time lags in the spread of emission-curbing technological advances, which are compounded by the effects of rapid population growth.
"Sometimes these lags are technical in nature, but -- as recent history amply demonstrates -- they also can be caused by political or economic barriers," Manoli explained. "Whatever the cause, our quantification of the delays historically associated with such challenges shows that a tenfold acceleration in the spread of green technologies is now necessary to cause some delay in the Doomsday Clock."
Manoli, who is now on the research staff at ETH Zurich's Institute of Environmental Engineering, conducted the new study with Gabriel G. Katul, the Theodore S. Coile Professor of Hydrology and Micrometeorology, and Marco Marani, professor of ecohydrology. Katul and Marani are faculty members at Duke's Nicholas School of the Environment with secondary appointments in the Department of Civil and Environmental Engineering at Duke's Pratt School of Engineering.
________________________________________
Story Source:
Materials provided by Duke University. Note: Content may be edited for style and length.
________________________________________
Journal Reference:
1. Gabriele Manoli, Gabriel G. Katul, Marco Marani. Delay-induced Rebounds in CO2 Emissions and Critical Time-Scales to Meet Global Warming Targets. Earth's Future, 2016 DOI: 10.1002/eft2.2016EF000431
|
|
|
|
Post by swamprat on Jan 5, 2017 21:31:58 GMT -6
China to plow $361 billion into renewable fuel by 2020 Global Energy News
by Josephine Mason
Thu Jan 5, 2017
China will plow 2.5 trillion yuan ($361 billion) into renewable power generation by 2020, the country's energy agency said on Thursday, as the world's largest energy market continues to shift away from dirty coal power towards cleaner fuels.
The investment will create over 13 million jobs in the sector, the National Energy Administration (NEA) said in a blueprint document that lays out its plan to develop the nation's energy sector during the five-year 2016 to 2020 period.
The NEA said installed renewable power capacity including wind, hydro, solar and nuclear power will contribute to about half of new electricity generation by 2020.
The agency did not disclose more details on where the funds, which equate to about $72 billion each year, would be spent.
Still, the investment reflects Beijing's continued focus on curbing the use of fossil fuels, which have fostered the country's economic growth over the past decade, as it ramps up its war on pollution.
Last month, the National Development and Reform Commission (NDRC), the country's economic planner, said in its own five-year plan, that solar power will receive 1 trillion yuan of spending, as the country seeks to boost capacity by five times. That's equivalent to about 1,000 major solar power plants, according to experts' estimates.
The spending comes as the cost of building large-scale solar plants has dropped by as much as 40 percent since 2010. China became the world's top solar generator last year.
"The government may exceed these targets because there are more investment opportunities in the sector as costs go down," said Steven Han, renewable analyst with securities firm Shenyin Wanguo.
Some 700 billion yuan will go towards wind farms, 500 billion to hydro power with tidal and geothermal getting the rest, the NDRC said.
The NEA's job creation forecast differs from the NDRC's in December that said it expected an additional 3 million jobs, bringing the total in the sector to 13 million by 2020.
Concerns about the social and economic costs of China's air pollution have increased as the northern parts of the country, including the capital Beijing, have battled a weeks-long bout of hazardous smog.
Illustrating the enormity of the challenge, the NEA repeated on Thursday that renewables will still only account for just 15 percent of overall energy consumption by 2020, equivalent to 580 million tonnes of coal.
More than half of the nation's installed power capacity will still be fueled by coal over the same period.
www.reuters.com/article/us-china-energy-renewables-idUSKBN14P06P
|
|
|
|
Post by skywalker on Jan 8, 2017 17:45:19 GMT -6
Amazing. That atmospheric scientist just said the exact same things I have been saying for decades. Once again I will give myself a pat on the back for being right,  (Pat pat pat)  |
|


 Sorry, Sky!


